One of the things I’ve discovered this week is that, while fruit is considered to be relatively high-fiber, not all fruit is necessary good as a cheat food for when you have the munchies and need something betweeen meals.
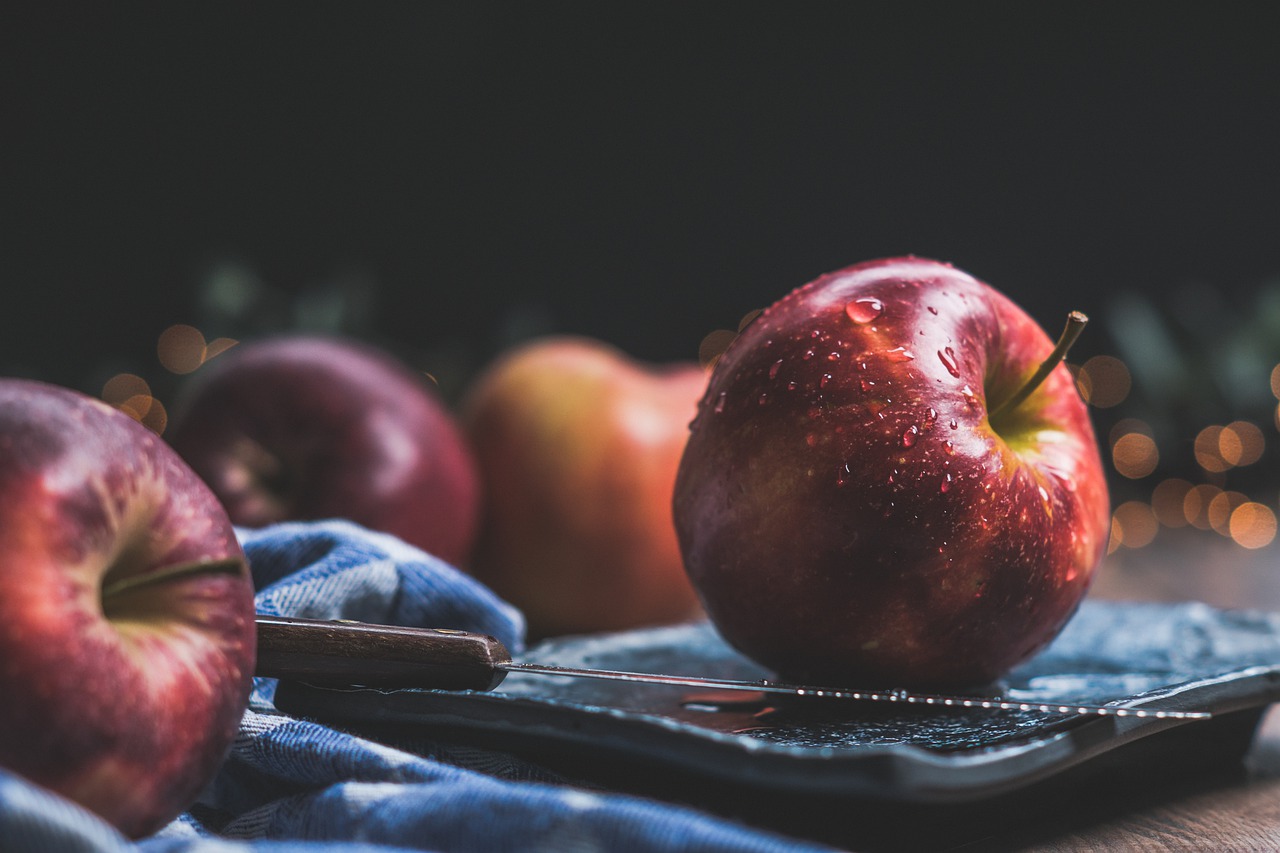
The last week I picked up a couple of fruit trays containing cantaloupe, honeydew, watermelon, pineapple, and grapes from Wal-Mart after claiming that fruit was a good cheat food. I really should have known better as the glycemic index of all of these foods are way higher than the granny smith apples I have been munching on when my head and stomach are at odds with each other.
This is a chart I’ve developed that shows one method of evaluating fruits based on a sugar-to-fibre ratio and their impact on body chemistry factoring for glycemic load.
| Carbs | Sugar | Fibre | GI | GL | Rating | Log(R) | |
| Avocado | 17.0 | 1.0 | 16 | 15 | 4.0 | 0.25 | -0.60 |
| Feijoa | 5.0 | 1.0 | 4 | 35 | 2.0 | 0.50 | -0.30 |
| Raspberries | 14.7 | 5.4 | 9.3 | 32 | 3.0 | 1.74 | 0.24 |
| Blackberries | 15.0 | 7.0 | 8 | 32 | 4.0 | 3.50 | 0.54 |
| Papaya | 14.0 | 8.0 | 6 | 59 | 3.0 | 4.00 | 0.60 |
| Strawberries | 12.0 | 7.0 | 5 | 32 | 3.0 | 4.20 | 0.62 |
| Apricot | 3.9 | 3.2 | 0.7 | 57 | 1.0 | 4.57 | 0.66 |
| Kiwifruit | 11.1 | 6.8 | 4.3 | 53 | 3.0 | 4.74 | 0.68 |
| Grapefruit | 26.2 | 16.0 | 10.2 | 25 | 4.0 | 6.27 | 0.80 |
| Pear | 28.0 | 17.0 | 11 | 38 | 5.9 | 9.12 | 0.96 |
| Banana | 27.0 | 14.4 | 12.6 | 52 | 10.0 | 11.43 | 1.06 |
| Dates | 5.0 | 4.0 | 1 | 42 | 3.0 | 12.00 | 1.08 |
| Blueberries | 21.0 | 14.4 | 6.6 | 40 | 5.8 | 12.65 | 1.10 |
| Plum | 8.0 | 7.0 | 1 | 39 | 2.0 | 14.00 | 1.15 |
| Cherries | 18.7 | 15.0 | 3.7 | 22 | 3.5 | 14.19 | 1.15 |
| Nectarine | 15.0 | 11.2 | 3.8 | 42 | 5.0 | 14.74 | 1.17 |
| Watermelon | 12.0 | 10.0 | 2 | 72 | 3.0 | 15.00 | 1.18 |
| Apple | 25.1 | 18.9 | 6.2 | 38 | 5.2 | 15.85 | 1.20 |
| Pineapple | 22.0 | 16.0 | 6 | 59 | 6.0 | 16.00 | 1.20 |
| Figs | 9.6 | 8.1 | 1.5 | 61 | 3.0 | 16.20 | 1.21 |
| Orange | 15.4 | 12.2 | 3.2 | 42 | 4.9 | 18.68 | 1.27 |
| Peach | 15.0 | 13.0 | 2 | 42 | 5.0 | 32.50 | 1.51 |
| Cantaloupe | 16.0 | 13.9 | 2.1 | 65 | 5.0 | 33.10 | 1.52 |
| Honeydew | 16.1 | 14.4 | 1.7 | 65 | 4.0 | 33.88 | 1.53 |
| Grapes | 27.0 | 23.0 | 4 | 46 | 9.0 | 51.75 | 1.71 |
| Mango | 35.0 | 31.0 | 4 | 56 | 10.0 | 77.50 | 1.89 |
The formula I’m using for the rating system here is R = Log(GL*(Sugar/Fibre)).
As you can see, cantaloupe, honeydew, and grapes are all at the bottom of the list owing to the amount of natural sugar as compared to fibre. And while apples are not exactly at the bottom of the list, neither are they as counter productive.
One of the odd findings from this chart is where bananas place. While banana’s have a high glycemic load, the sugar to fibre ratio actually make them one of the healthier fruit options. However it is important to note that this ratio changes depending on whether your bananas are green or ripe to the point where banana bread is the only option for saving them. So just a word of caution there.
The important take away from this is that, if you are going to have a cheat snack, you want to take from the top of the list, not the bottom. While fruit is healthy in almost all instances, we are still trying to lose weight here and the more fibre / less sugar a fruit contains, the better it will be at keeping your weight loss consistently going in the right direction.
— Kevin
